The cone of uncertainty is the result of statistics from software projects over the past 60 years. It has roots in the engineering and chemical engineering from the 1950’s and was brought into software development in 1981.
It represents how estimations become more accurate over the life cycle of a project.

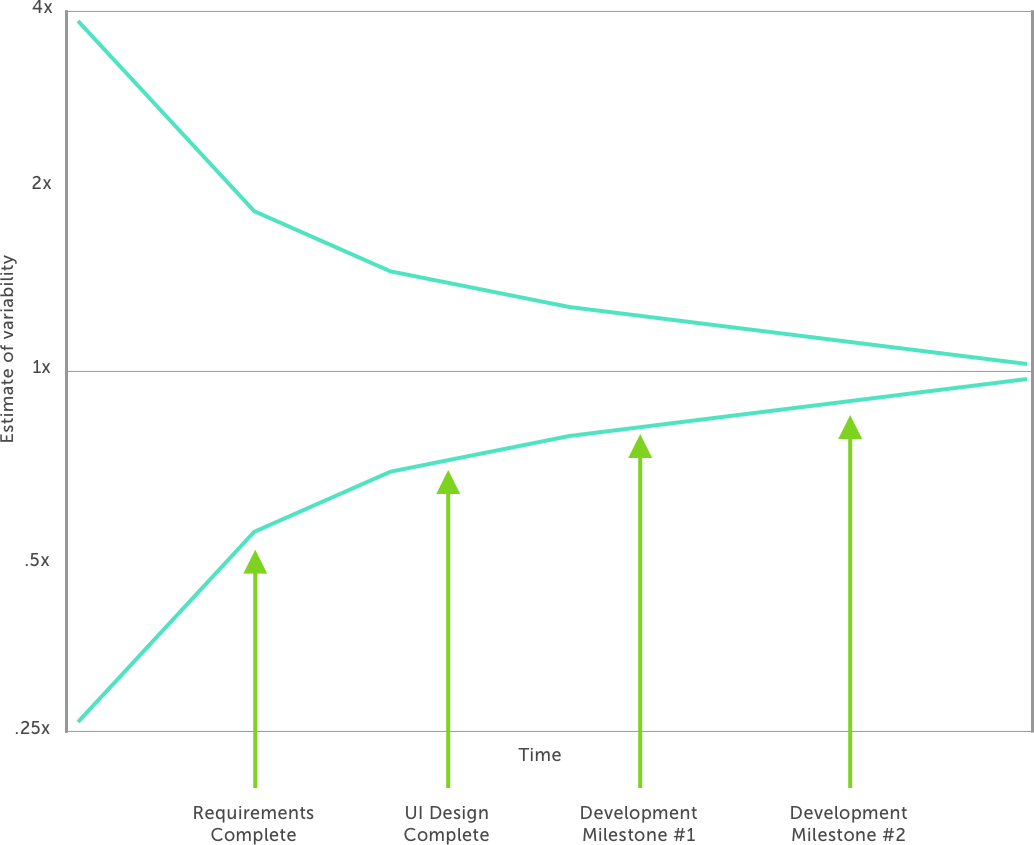
Looking at the graph above we can see that at the start of a project the estimation is only accurate by a factor of plus or minus 4. Meaning that on day 1 if the estimate is 1 year, the project could take anywhere between 3 months (25% of the original estimate), or 4 years (x 4 the original estimate).
However, as time progresses we are able to re-estimate as more accurate information or data comes to light. The graph below shows 4 milestones at points where we re-estimate, and as we do the cone of uncertainty becomes narrower along with the margin for error.

An important thing to note when looking at the graph is that the estimate is never 100% accurate. Throughout the entire project life cycle you refine and re-estimate based on new information, the estimation will alwaysbe inaccurate, however the margin for error will decrease exponentially as time progresses, and until the project is complete.