Used to fine tune and tweak animations, you’ll spend a lot of time using it when animating.
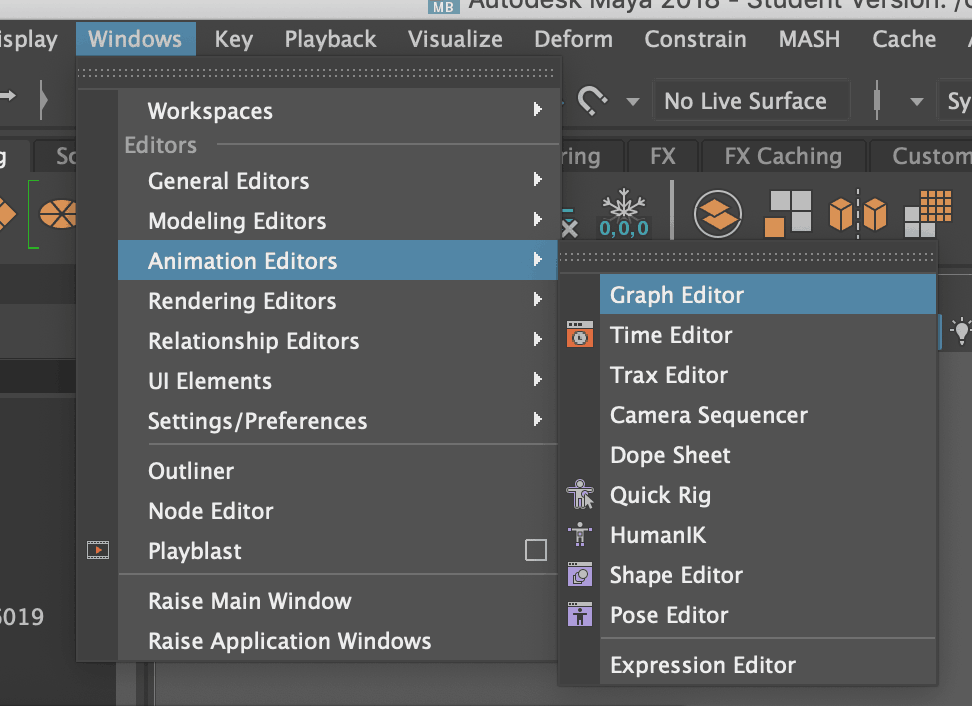
You can access the graph editor from the main menu, windows > Animation Editors > Graph Editor:
Lets say we already have an object which we have animated, and it already has a couple of keys in the timeline. Select one of the frames which has a key, and select the animated object in the workspace. Then open the Graph editor (see above).

The left panel is the graph editor ‘outline’ it shows our object we have selected (in this case it’s a parent control curve). and also our channels that our key is applied to (only channels with keyframes will appear in this panel).
The right panel displays the function curves.
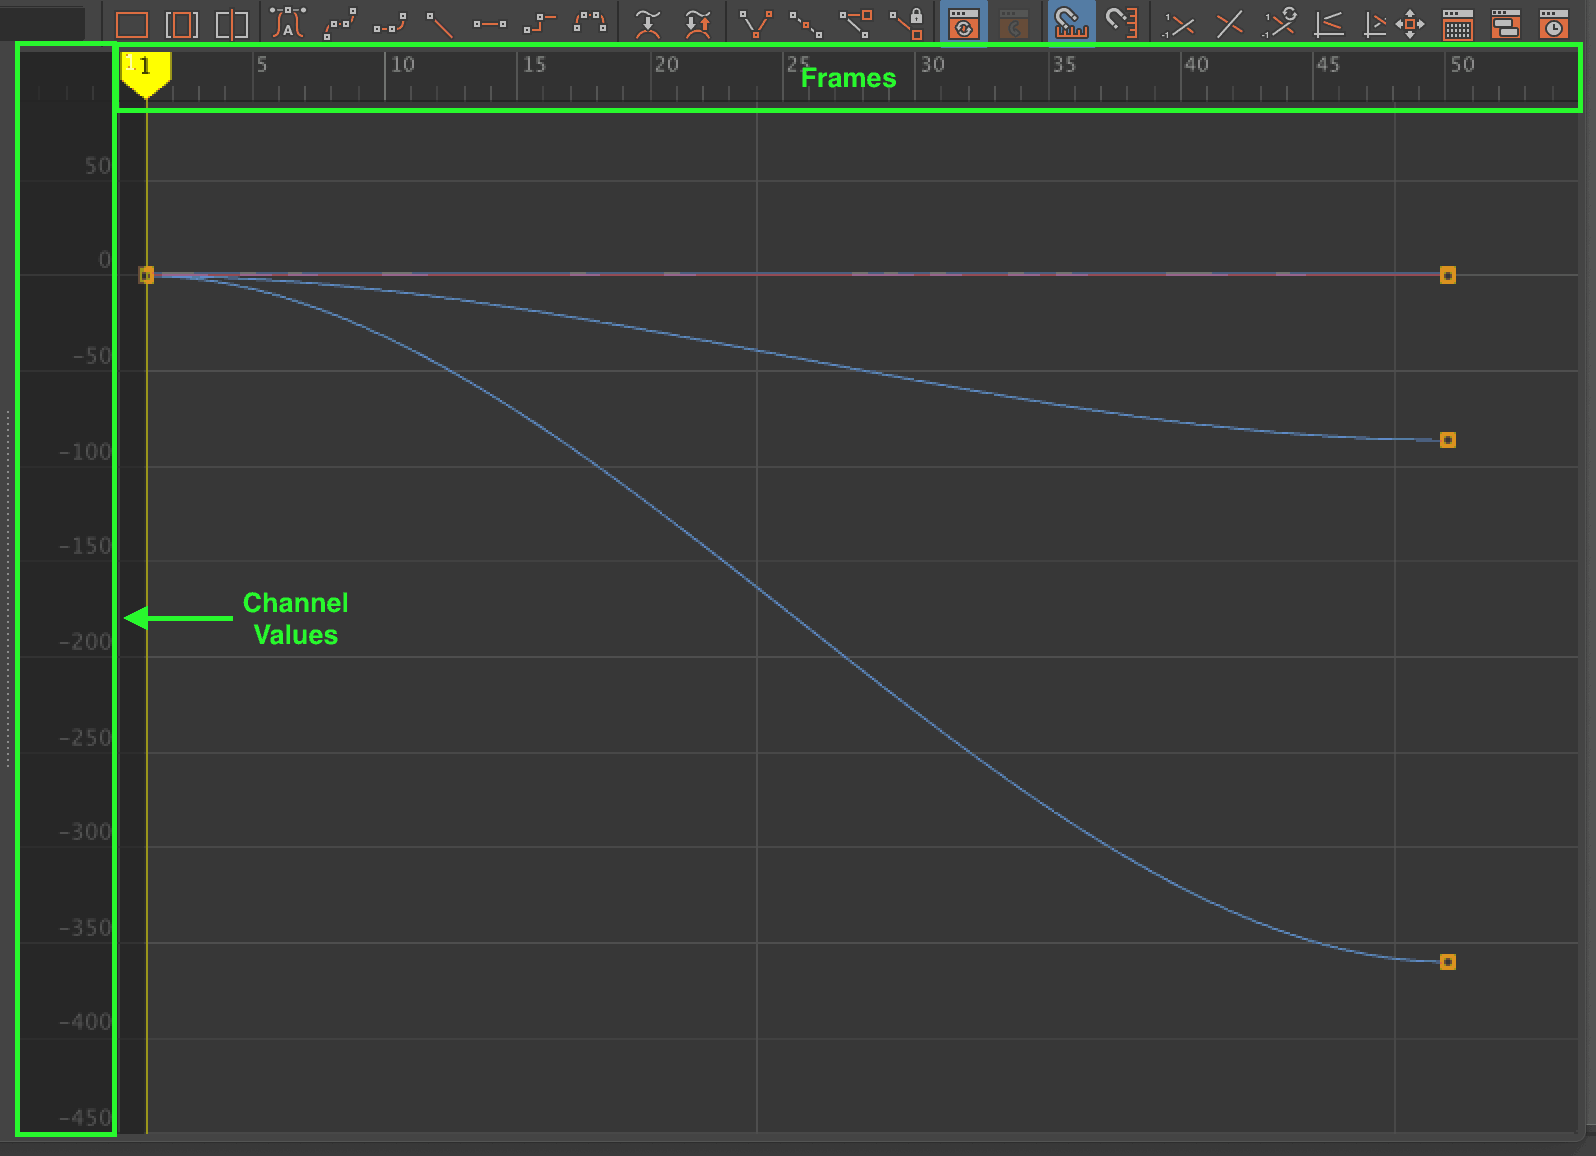
The orange boxes in the graph represent the keyframes of our animation:

The graph can look a little confusing with every curve being displayed, we can very easily isolate individual curves, to do this simple select any of the channels in the graph editor outline panel.
You’ll notice that the graph is up dated to display only that 1 channel:

To select a range of channels hold Shift when selecting:

To select specific channels hold CTRL when selecting the channels. You can pan and zoom the graph using the same method you do to pan in the workspace when you are modelling.

If you manage to make a mess of the panning and zooming and you
Graph UI elements
The top values are the frames of the animation, and the left values are the actual channel values:

We can see this better if we isolate a specific channel and see what the graph is telling us, lets isolate the translate Z channel:

We can see that for the translate Z channel, at frame 50, the value of translate Z will be around -85, we can confirm this by switching over to our channel box:

You can also select the key in the graph and confirm these values within the Graph Editor UI. Simply click on the key and at the top of the graph editor you’ll notice a ‘Stats’ section, the first box displays the frame (50), and the 2nd displays the value (-86.162):
